Forecasts of electric vehicle sales in Australia to 2035
The electric vehicle market in Australia is still very small with total estimated sales of around 1680 vehicles in 2017-18. This represents less than 0.1 per cent of total vehicle sales.
Car manufacturers, however, are continuing to introduce new electric vehicles and the roll-out of charging stations continues. The large-scale adoption of electric vehicles in Australia will follow rapidly provided:
- EV vehicle and battery costs continue to fall;
- the range (km) of EVs increases to parity with petrol vehicles;
- rapid roll out of charging stations in both the private and public sectors; and
- trip and fuel management systems in EVs improve.
The uptake of EVs through the 2020s decade will be overshadowed by the uptake of Hybrid vehicles. In July 2017, Volvo manufacturer announced it would transition to EVs and Hybrid vehicles. Hybrid vehicles can run for a significant distance before switching to petrol or diesel – and mild hybrids, where a battery helps a conventional engine achieve greater fuel economy.
Although current penetration of PEVs is very low (less than 0.2 per cent of auto sales in 2018), reductions in battery costs and reliability (range, etc.) are foreseen to accelerate PEV penetration, particularly post-2030. Managed PEV charging (to avoid peak charging), the possibility of vehicle-to-grid (V2G) and vehicle-to-home (V2H) electricity flows, and reductions in fuel excise revenues are PEV issues which will challenge policy-makers in the electricity and transport areas.
In this projection there is a continued low take-up of EVs until 2025 and then the take-up rate accelerates rapidly. Electric vehicles are modelled for the passenger and SUV stocks. These fleets have a significant number of commercial vehicles, who would lead the take-up of the EVs. The take-up rates could be bolstered by capital or financial incentives for EVs. The total EV stock rises to 25,000 vehicles by 2020, 109,000 vehicles by 2025 and 481,000 million vehicles by 2030. By 2035, there are 2.5 million EVs in Australia, representing more than 10 percent of the total motor vehicle stock.
Projections of electric vehicle sales are presented in Table 3. Forecasts of sales and stock numbers of passenger and SUV vehicles, total stocks of electric vehicles and energy use of electric vehicles can be found in the full electric vehicle projections report.
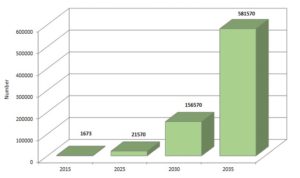
Total EV sales were 0.2 per cent of total passenger and SUV sales in 2017-18. By 2020 they increase to 1.0 per cent of total sales and by 2030, 14 per cent of total passenger and SUV sales. By 2035 they reach 50 per cent of total passenger and SUV sales.
Figure 1: Electric vehicle sales : Australia (number)
| Table 3 Passenger and SUV motor vehicle – electric vehicle sales (number) | ||||||||
| Year | NSW | VIC | QLD | SA | WA | TAS | NT | AUST |
| 2013 | 89.00 | 120.00 | 50.00 | 35.00 | 47.00 | 4.00 | 0.00 | 345.00 |
| 2014 | 184.00 | 196.00 | 110.00 | 99.00 | 78.00 | 11.00 | 2.00 | 680.00 |
| 2015 | 327.00 | 369.00 | 218.00 | 434.00 | 138.00 | 20.00 | 4.00 | 1510.00 |
| 2016 | 350.00 | 339.00 | 206.00 | 400.00 | 95.00 | 28.00 | 5.00 | 1423.00 |
| 2017 | 506.00 | 387.00 | 184.00 | 152.00 | 74.00 | 11.00 | 4.00 | 1318.00 |
| 2018 | 635.00 | 446.00 | 224.00 | 243.00 | 117.00 | 7.00 | 1.00 | 1673.00 |
| 2019 | 5226.40 | 1138.83 | 557.79 | 1254.41 | 261.12 | 24.61 | 6.84 | 8470.00 |
| 2020 | 5608.52 | 1887.25 | 930.98 | 1346.00 | 450.28 | 37.64 | 9.33 | 10270.00 |
| 2025 | 6888.66 | 7415.35 | 3650.79 | 1674.92 | 1750.14 | 151.31 | 38.84 | 21570.00 |
| 2030 | 46645.21 | 56153.06 | 27646.55 | 11430.82 | 13255.06 | 1145.44 | 293.85 | 156570.00 |
| 2035 | 168057.19 | 212194.75 | 104472.50 | 41317.67 | 50088.99 | 4328.49 | 1110.42 | 581570.00 |
| Percentage changes | ||||||||
| 2014 | 106.74 | 63.33 | 120.00 | 182.86 | 65.96 | 175.00 | 0.00 | 97.10 |
| 2015 | 77.72 | 88.27 | 98.18 | 338.38 | 76.92 | 81.82 | 100.00 | 122.06 |
| 2016 | 7.03 | -8.13 | -5.50 | -7.83 | -31.16 | 40.00 | 25.00 | -5.76 |
| 2017 | 44.57 | 14.16 | -10.68 | -62.00 | -22.11 | -60.71 | -20.00 | -7.38 |
| 2018 | 25.49 | 15.25 | 21.74 | 59.87 | 58.11 | -36.36 | -75.00 | 26.93 |
| 2019 | 723.05 | 155.34 | 149.02 | 416.22 | 123.18 | 251.55 | 583.57 | 406.28 |
| 2020 | 7.31 | 65.72 | 66.90 | 7.30 | 72.44 | 52.96 | 36.50 | 21.25 |
| 2021 | 0.49 | 56.62 | 56.20 | 0.49 | 54.32 | 61.53 | 69.23 | 18.50 |
| 2022 | 1.54 | 36.38 | 36.52 | 1.66 | 37.17 | 34.76 | 32.42 | 16.43 |
| 2023 | 4.01 | 28.51 | 28.46 | 4.18 | 28.20 | 29.17 | 30.14 | 16.23 |
| 2024 | 6.85 | 21.84 | 21.87 | 7.40 | 21.97 | 21.57 | 21.18 | 15.18 |
| 2025 | 8.32 | 17.48 | 17.47 | 8.87 | 17.42 | 17.60 | 17.77 | 13.71 |
| Compound growth rate (per cent) | ||||||||
| 2015-2020 | 76.55 | 38.60 | 33.69 | 25.40 | 26.68 | 13.48 | 18.46 | 46.73 |
| 2020-2030 | 23.59 | 40.40 | 40.37 | 23.85 | 40.25 | 40.71 | 41.20 | 31.31 |
| 2015-2035 | 36.63 | 37.40 | 36.15 | 25.58 | 34.27 | 30.85 | 32.49 | 34.67 |
Recent Comments