Victorian regional climate conditions during summer peak demand
The Victorian electricity network typically peaks during summer on a hot day. The Victorian summer peak is usually the annual peak as there is usually greater demand than the winter peak. This reflects the high penetration of air conditioners in Victorian households (that use electricity). Victorians also have good access to gas, so it is commonly used for heating during winter rather than electricity.
There is also increasing use of reverse cycle air conditioners during winter for heating as these units are capable of both heating and cooling. This trend is reflecting in increasing air conditioner efficiency (improved coefficient of performance) and trends toward smaller living spaces in apartments and units.
Installations of small-scale photovoltaic systems also work to dampen summer peak demand compared to winter peak demand (when PV generation is negligible).
The following sections are intended to give a brief overview of Victorian summer peak demand and the prevailing climate conditions around the state during the 2017-18 summer peak demand event. Each of the Australian state peak demands are covered in the full report, Australian State Electricity Peak Demands and Regional Climate.
Historical Victorian summer peaks
Table 2 shows the historical Victorian summer peak demands from 2007 to 2018. The table shows the demand during the peak interval (MW), the time that the peak occurred, and the daily temperature conditions on the day the peak occurred.
Over the past twelve summers, Victorian summer peak demand has occurred:
- with a peak demand of between 8,713 MW to 10,493 MW;
- on a day with an average temperature of between 27.7 to 35 degrees Celsius;
- on a day with a maximum temperature of between 35 to 44.3 degrees Celsius;
- on a day with a minimum temperature of between 16.8 to 24.5 degrees Celsius;
- usually in January or early February, but potentially as late as March; and
- in the late afternoon around 4:00 PM on average
| Table 2 Historical Victorian maximum demand – 2018 | ||||||
| Financial year | Peak date | Peak time | Peak demand (MW) | Average temperature | Maximum temperature | Minimum temperature |
| 2007 | 16/01/2007 | 3:00PM | 9,062 | 28.8 | 40.8 | 16.8 |
| 2008 | 17/03/2008 | 4:00PM | 9,818 | 29.7 | 38.4 | 20.9 |
| 2009 | 29/01/2009 | 12:30PM | 10,493 | 35.0 | 44.3 | 25.7 |
| 2010 | 11/01/2010 | 4:00PM | 10,107 | 31.3 | 43.6 | 19.0 |
| 2011 | 1/02/2011 | 12:30PM | 9,916 | 32.4 | 40.2 | 24.5 |
| 2012 | 24/01/2012 | 4:00PM | 9,177 | 27.7 | 35.0 | 20.4 |
| 2013 | 12/03/2013 | 4:30PM | 9,775 | 29.3 | 36.2 | 22.3 |
| 2014 | 28/01/2014 | 4:30PM | 10,312 | 32.6 | 41.5 | 23.8 |
| 2015 | 22/01/2015 | 4:00 PM | 8,626 | 27.8 | 36.2 | 19.4 |
| 2016 | 13/01/2016 | 5:00PM | 9,505 | 30.1 | 42.7 | 17.4 |
| 2017 | 9/02/2017 | 1:30PM | 8,713 | 28.8 | 36.4 | 21.1 |
| 2018 | 19/01/2018 | 4:00PM | 9,153 | 31.4 | 40.3 | 22.5 |
Victoria has not been able to beat the record peak demand of 10,493 MW that occurred 10 years ago in 2009. While Victorian state electricity demand has surpassed 10,000 MW on two other occasions over the sample period, most of the demands have been below 10,000 MW. The 2009 peak occurred on an incredibly hot day with a maximum temperature of 44.3 degrees Celsius and an average temperature of 35.0 degrees Celsius. Part of the reason that the 2009 record has not been achieved again is that these weather conditions have not been matched either.
The 2009 summer season also preceded heavy pushes into energy efficiency and the boom in the residential PV market. Air conditioner penetrations in Victoria had also been rapidly growing over the 2000’s decade.
The summer peak during 2014 came close to the record with a demand of 10,312 MW. This occurred during a heat wave with multiple days of above 40 degree temperatures.
Since 2014 Victorian state peak demand has been historically low, twice falling below 9,000 MW in 2015 and 2017 at 8,626 MW and 8,713 MW respectively. This is partly due to the closure of the Point Henry in late 2014, which consumed around 306 MW on average at the time of Victorian peak demand.
Figure 4 shows Victorian summer peak demand on the left axis, with the coincident CDD and standard CDD (POE 50) on the right axis. During a standard year (50 probability of exceedance) the CDD is expected to be just below 14 CDD. The standard CDD is trending slightly upwards due to warming effects.
Also contributing to the mild peak demands over recent years are the low temperature conditions at the peak, with 2015, 2016 and 2017 all being relatively mild years.
As can also be seen in Figure 4, variability in Victorian peak demand is closely linked to movements in the CDD index.
Figure 4: Victorian summer peak demand and Cooling Degree Days
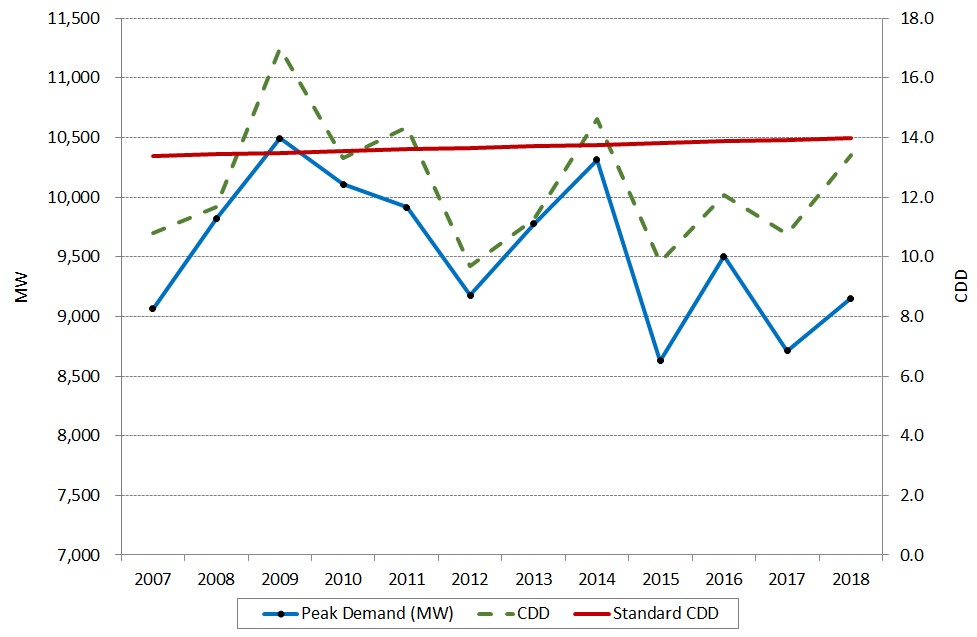
Victoria’s peak demand in summer 2018 occurred on Friday, 19 January and reached a level of 9,153 MW on a day with an average temperature of 31.4 degrees and a maximum temperature of 40.3 degrees.
The 2018 peak was relatively low on a day with around standard peak CDD. The peak occurred on a Friday afternoon, which typically has a lower demand than the middle of the week. Some business and government organisations are also still closed during this time, and people can still be on holidays reducing the impact on Melbourne electricity networks.
The 2017-2018 summer also saw the introduction of ARENA funded demand response programs during summer. The Victorian recipients were United Energy, EnerNOC, Powershop Australia, EnergyAustralia and Zen Ecosystems.
Regional weather during Victorian summer peak demand
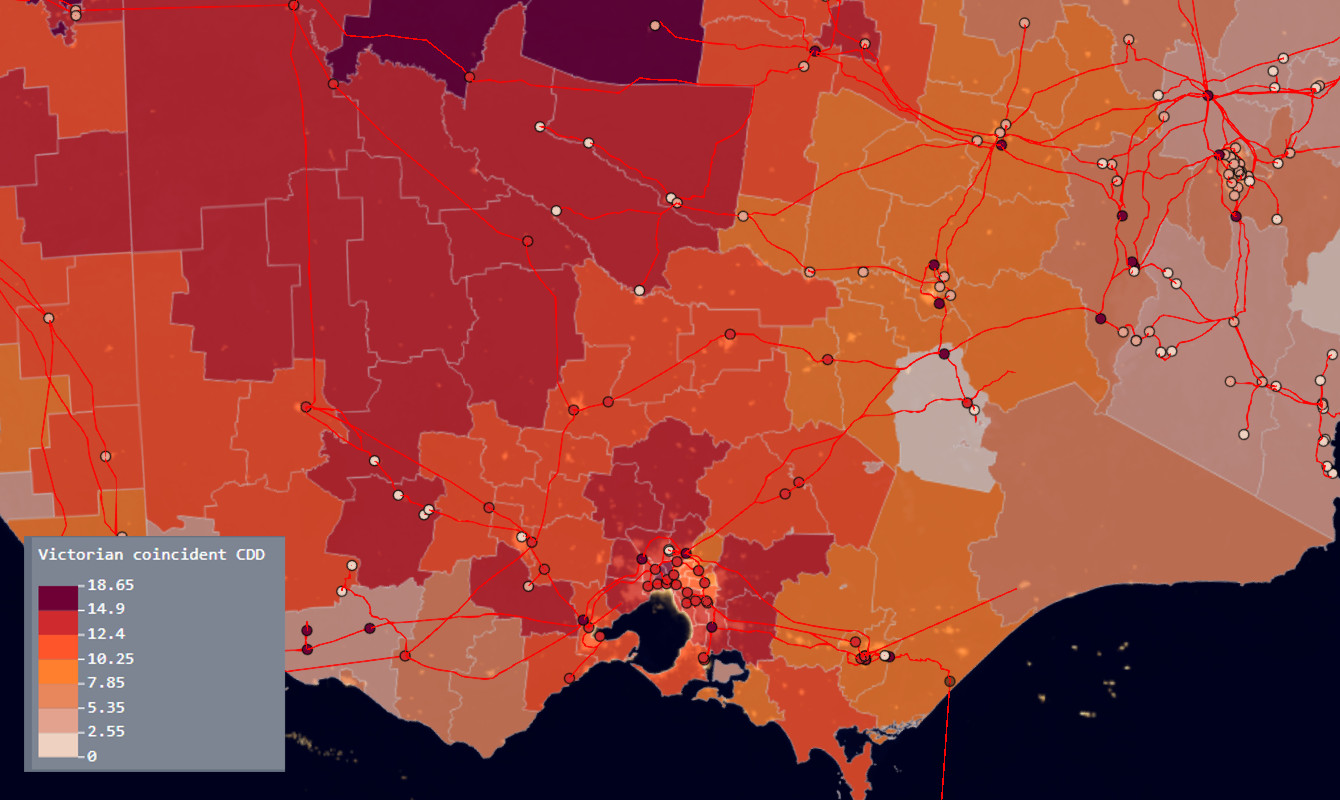
The following figures summarise the CDD’s on the 19 January 2018, at the time of the Victorian peak demand. These show the temperature conditions around the state and within the Greater Melbourne region. These spatial maps have all been generated with NIEIR data using National Map (http://nationalmap.gov.au/). Victoria’s transmission network has also been overlayed on the map.
Figure 5 show the whole of Victoria CDD’s by Local Government Area coincident to 2018 summer peak demand. The highest CDD regions are toward the states North-West. These also have a low population density so have relatively minimal impact on state electricity demand. Generally, the coastal regions across Gippsland and south-western Victoria were cooler than the rest of the state.
Most importantly, the Melbourne and surrounding regions experienced extreme weather conditions, similarly to the states north-west.
Figure 5: Cooling Degree Days coincident to Victorian maximum demand – State region
The Victorian electricity network maintains a strong relationship to weather conditions in Melbourne. The Victorian population and economic activity are heavily concentrated in around Port Phillip Bay with most Victorians living in the capital city. Victoria’s next largest city, Geelong, is only 75 kilometres south west of Melbourne. That means that temperature conditions are likely to be very similar during peak times as they are within Melbourne.
There are also a number of other regional cities across Victoria that have a comparatively small electricity demand. Many of these cities, such as Bendigo and Ballarat, also experienced hot conditions on the same day (although less than the capital).
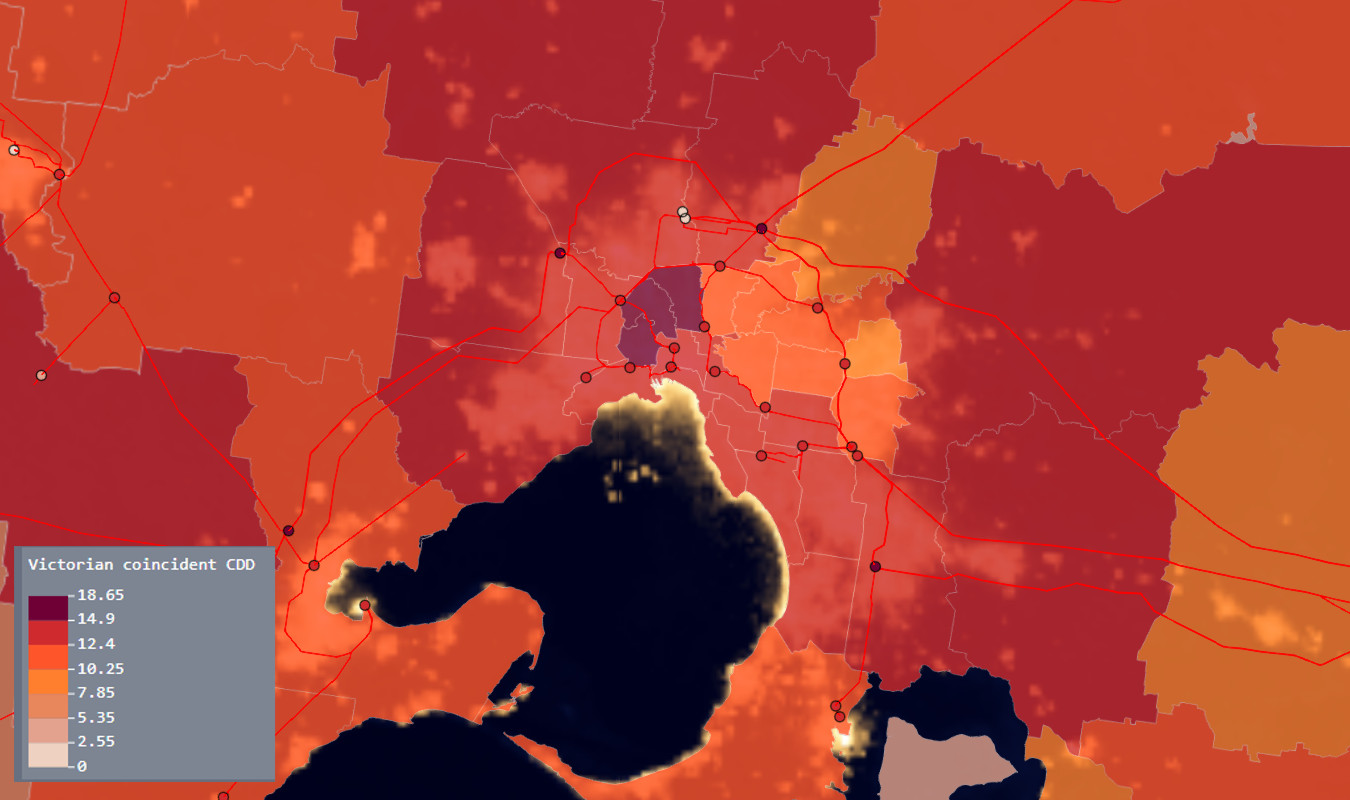
Figure 6 contains a closer view of Melbourne and the surrounding regions. The majority of Melbourne city experienced hot weather conditions between 12.4 and 14.9 CDD. A notable exception is Melbourne’s inner North West, which had CDD of above 14.9. The Yarra Valley and Dandenong ranges area experienced a slightly cooler day than the rest of Melbourne.
Figure 6: Cooling Degree Days coincident to Victorian maximum demand – Greater Melbourne region

Recent Comments